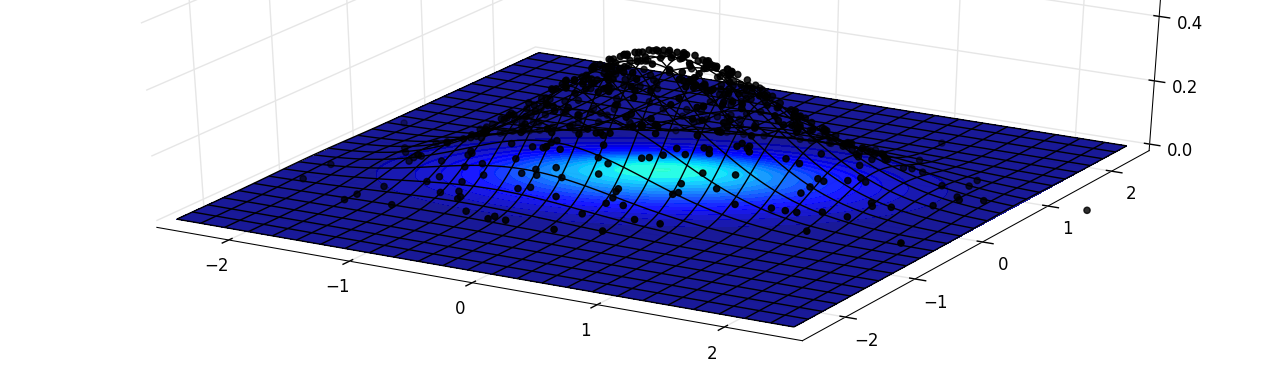
It is often easy to compare, in dimension one, an histogram and the underlying density. This is quite useful when one want to visually evaluate the goodness of fit between the data and the model. Unfortunately, as soon as the dimesion goes higher, this visualization is harder to obtain. Here, I will present a short snippet rendering the following plot:
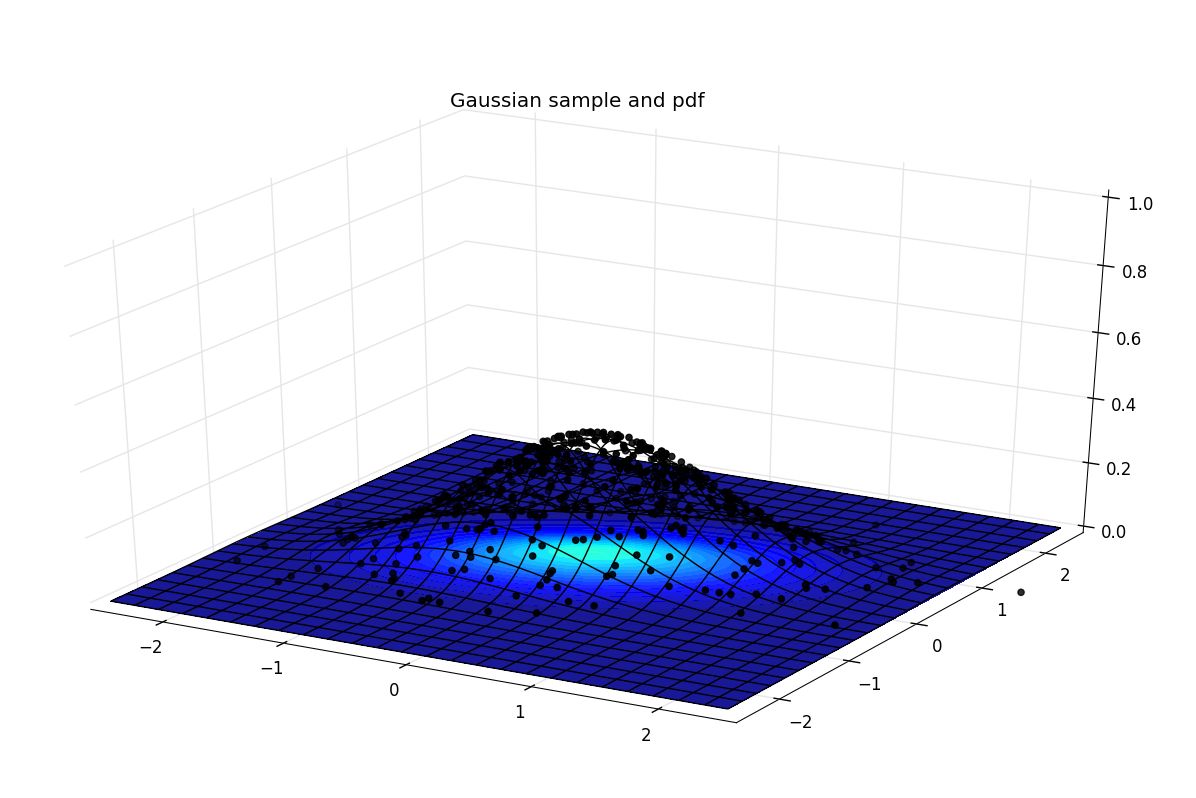
The heatmap is flat, on top of it, a wireframe is plotted and the sampled points are constrained to have the same height as the wireframe, so that their density is more visual.
Feel free to use the snippet below :)
from mpl_toolkits.mplot3d import Axes3D
import numpy as np
import matplotlib.pyplot as plt
from matplotlib import cm
from scipy.stats import multivariate_normal


# Sample parameters
mu = np.array([0, 0])
sigma = np.array([[0.7, 0.2], [0.2, 0.3]])
rv = multivariate_normal(mu, sigma)
sample = rv.rvs(500)

# Bounds parameters
x_abs = 2.5
y_abs = 2.5
x_grid, y_grid = np.mgrid[-x_abs:x_abs:.02, -y_abs:y_abs:.02]

pos = np.empty(x_grid.shape + (2,))
pos[:, :, 0] = x_grid
pos[:, :, 1] = y_grid

levels = np.linspace(0, 1, 40)

fig = plt.figure()
ax = fig.gca(projection='3d')

# Removes the grey panes in 3d plots
ax.xaxis.set_pane_color((1.0, 1.0, 1.0, 0.0))
ax.yaxis.set_pane_color((1.0, 1.0, 1.0, 0.0))
ax.zaxis.set_pane_color((1.0, 1.0, 1.0, 0.0))

# The heatmap
ax.contourf(x_grid, y_grid, 0.1 * rv.pdf(pos),
            zdir='z', levels=0.1 * levels, alpha=0.9)

# The wireframe
ax.plot_wireframe(x_grid, y_grid, rv.pdf(
    pos), rstride=10, cstride=10, color='k')

# The scatter. Note that the altitude is defined based on the pdf of the
# random variable
ax.scatter(sample[:, 0], sample[:, 1], 1.05 * rv.pdf(sample), c='k')

ax.legend()
ax.set_title("Gaussian sample and pdf")
ax.set_xlim3d(-x_abs, x_abs)
ax.set_ylim3d(-y_abs, y_abs)
ax.set_zlim3d(0, 1)

plt.show()
Learning more
Data Visualization with Python for Beginners and Matplotlib 3.0 Cookbook are complete references for using Matplotlib and Seaborn